Applications of Photoacoustics in Medical Diagnostics
Surya N. Thakur1 and Punam Rai2
1Department of Physics, Banaras Hindu University, Varanasi-221005, India
2Opal Hospital, Kakarmatta, Varanasi-221006, India
1. Introduction
Photoacoustic spectroscopy (PAS) leverages the photoacoustic effect, discovered by Graham Bell in 1880 [1,2],
where sound waves are generated as light energy is absorbed by a material. When modulated or pulsed laser
light is absorbed, rapid heating causes thermal expansion, producing pressure waves (sound) detected by
sensitive microphones or piezoelectric sensors. This sound is converted into an electrical signal representing
the photoacoustic (PA) response of the material.
In PAS, a tunable laser light excites the sample generating a photoacoustic spectrum to identify specific
molecules based on wavelength absorption. PAS enables quantitative detection of molecular concentrations
and is noninvasive, highly sensitive, and effective for detecting trace gases and studying biological tissues.
In addition to spectroscopy, photoacoustics is also used as a hybrid imaging technology. In photoacoustic
imaging (PAI), laser-induced ultrasound waves in tissues provide high-resolution images with deep tissue
penetration, useful for medical diagnostics and biological research
PAS of biological tissues like skin detects molecules such as hemoglobin and melanin offering insights
into biological processes. PAS is also highly effective for detecting trace amounts of gases in air or
exhaled breath, making it useful for environmental monitoring and medical diagnostics. PAI can also
integrate with ultrasound for real-time imaging without external contrast agents, allowing clear
visualization of endogenous chromophores and deep tissue features. After a methodology overview,
the applications of PAS and PAI in medical diagnostics and monitoring therapeutic efficacy will be
discussed.
2. Photoacoustic spectroscopy, apparatus and methods
The generation of a photoacoustic (PA) signal from a solid sample can be explained using a cylindrical
photoacoustic cell, where the light-absorbing solid sample is surrounded by optically transparent gas (air)
in front, with a backing material that poorly conducts heat (see Fig. 1). Absorption of a specific wavelength
generates heat via nonradiative transitions. The acoustic signal in the gas is caused by periodic heat flow
from the sample. The Rosencwaig-Gersho model for PA signal generation depends on both optical and
thermal properties of the solid [3]. The heat flow heats a thin layer of gas, its thickness depending on the
light chopping frequency (about 1 mm at 100 Hz). This layer (shown in red in Fig.1), acting like a vibratory
gas piston produces the acoustic signal detected by the microphone.

Fig. 1 Photoacoustic cell for a solid sample. Thermal waves originate from the point of absorption and travel towards
the solid-gas interface to periodically heat a thin layer of gas (shown in red).
2.1 Photoacoustics spectroscopy of gases
The generation of a photoacoustic (PA) signal in a gaseous sample is illustrated in Fig. 2. The photoacoustic
cell is a cylindrical tube with Brewster windows at both ends. The cell’s length is designed so that the
sound wave created by the periodic temperature rise from the absorption of a modulated light beam along
its axis forms an axial resonance pattern. The microphone is positioned near the antinode of the stationary
wave to achieve optimal sensitivity.

Fig. 2 Schematic diagram of a PA spectrometer for gaseous sample. The cw CO2 laser is attenuated down to a few
milliwatt output power before passing through the mechanical chopper.
The generation of photoacoustic (PA) signals at various locations in a PA cell, made from a 62.5 cm long
Pyrex tube with a 2.5 cm diameter and fitted with quartz windows at Brewster’s angle is shown in Fig.3(a).
The cell was resonant at 335 Hz, with maximum signal at the middle microphone port, and resonant at
669 Hz, with maximum signals at two ports symmetrically positioned on either side of the middle port.
These microphone ports correspond to the positions of three possible antinodes of the stationary acoustic
waves formed at the two resonant frequencies. To ensure acoustic isolation, the cell was placed in a wooden
box filled with sand. Two ports, not in use during the measurements, were sealed with O-rings and flat
Teflon discs. PA measurements were conducted using iodine vapor at room temperature, with air at
atmospheric pressure, and using 20 milliwatt Argon laser emitting light at 514.5 nm. The chopping
frequency of the laser light was varied between 27 and 1000 Hz and the resulting PA signals are shown
in Figs 3(b) to 3(d).
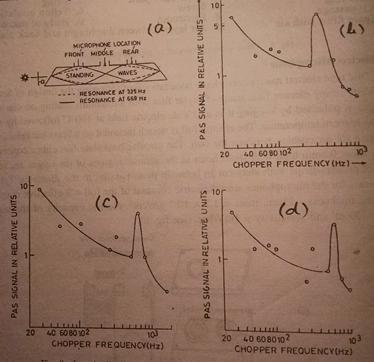
Fig. 3 Longitudinally resonant PA cell with three ports for microphone (a). PA signal for resonance at 335 Hz (b)
and those for resonance at 669 Hz (c ) and (d). [Adapted from Ref# 4]
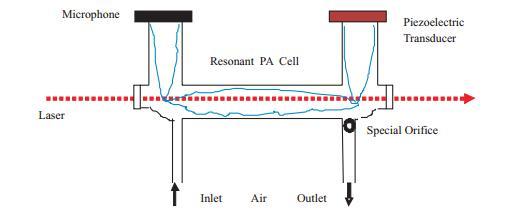
Fig. 4 Photoacoustic cell design for PA signal measurements in a flowing gaseous sample
For photoacoustic measurements on a flowing gas sample, such as for pollution monitoring, a different
type of acoustic resonant PA cell is required, as shown in Fig. 4. The U-shaped cell has a total length L,
corresponding to the acoustic wavelength generated by the modulated laser. The horizontal section is L/2,
and two two vertical sections at each end are L/4. At resonance, a stationary wave forms with antinodes
at the ends and center of the horizontal section, and nodes at the bent corners (see Fig.4). The laser, gas
inlet, and outlet are located near the low-pressure nodes to prevent fluctuations in the PA signal at the
antinodes. A microphone is placed near the open end of one vertical arm to detect the PA signal, while a
piezoelectric disc at the other vertical arm detects resonance frequency and quality factor. There is a 180o phase difference between high-pressure points at the center of the horizontal section and the two ends.
The sample’s flow is controlled by a narrow orifice at the outlet, maintaining steady pressure inside the
PA cell. The orifice creates a pressure drop of at least 50%, causing the airflow to reach the speed of sound.
This setup blocks noise from the pump entering the PA cell, preventing interference with the PA signal
2.2 PA spectroscopy of contaminated water
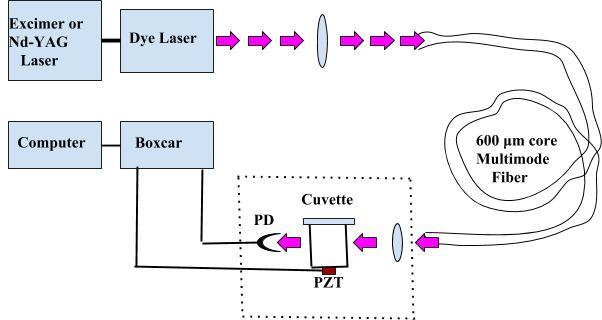
Fig. 5 Schematic PA spectroscopy system for trace detection of chemical species in polluted water.
The instrumentation for photoacoustic (PA) detection of liquid samples is relatively complex. A schematic
diagram of the set-up for detecting harmful pollutants in water is shown in Fig.5. A tunable dye laser,
pumped by either an excimer or Nd laser, is focused into a 600-micron core multimode optical fiber for
remote sample investigation. The polluted water is placed in a quartz cuvette, which is acoustically coupled
to a piezoelectric transducer. Light exiting the optical fiber is collimated into the quartz cuvette using a
10X microscope objective. To account for pulse-to-pulse energy fluctuations, the light exiting the cuvette
is monitored by a photodiode assembly, allowing the PA spectra to be normalazed against the dye laser
power. Both the PA and the photodiode signals are fed into separate gates of a boxcar integrator, and the
normalized spectrum is recorded by a computer as the dye laser wavelength is scanned. The quartz cuvette,
piezoelectric transducer, microscope objective and photodiode are mounted on a portable platform that can
easily be placed inside a glovebox for handling radioactive samples.
Klenze et al. [5] detected ultralow concentrations of Am3+and Pu4+ in aqueous solutions using an excimer
laser-pumped dye laser, while Russo et al. [6] recorded PA spectra of solutions containing Pr3+and Am3+with a Nd dye laser. Kim [7] has studied actinide colloid generation in ground water, which is important in
understanding geochemical interactions and actinide migration.
2.3 Pulsed laser-induced transient stress in tissue
A transient stress in tissue, caused by selective optical absorption by tissue chromophores, leads to a
pressure build-up and the release of a stress wave. This process triggers the ablation of soft tissues at low
pulsed radiant exposures by breaking of chemical bonds in the tissue. Rapid thermal expansion can lead
to material fracture due to mechanical stresses [8-10]. Selective photothermolysis is a potential ablation
mechanism when thermal energy is confined to the chromophore [11]. Laser absorption by the
extracellular matrix (ECM) chromophore directly targets tissue integrity, leading to bond breakage and
material removal. Photomechanical effects, especially at lower laser intensities, can cause tissue fracture
through stress-induced mechanical forces, making this method more energy-efficient than vaporization
[12]. When the laser pulse duration is shorter than or equal to the mechanical equilibrium time,
photomechanical mechanisms become crucial.

Fig. 6 Pulsed laser induced heating in a tumor and the formation of ultrasonic waves to be detected by a
piezoelectric transducer. The laser pulses at the absorption wavelength of the tumor get scattered by the
surrounding tissue and some of them reach the tumor to produce optical heating.
The generation of Photoacoustic (PA) signal from pulsed irradiated tissue requires no ablation,
Thermo-elastic waves at ultrasound frequencies are produced by stresses from photothermal heating
when laser pulse durations are of a few nanoseconds. Two conditions must be met:
Thermal confinement: occurs when the heat generated does not spread to surrounding tissue, requiring
the laser pulse duration τp to be shorter than the thermal diffusion time τth .
For typical tissue, a 5 ns laser pulse results in a thermal diffusion length of 0.05 μm .
Stress confinement: ensures that the stress transit time τs is larger than the laser pulse duration τp. For tissue, the stress transit time is about 10 ns.
These conditions show that a 5 ns laser pulse can create an ultrasonic image with 15 μm resolution, as
depicted in Fig. 4.
2.4 Photoacoustic Tomography
Photoacoustic tomography (PAT) is an imaging technology based on photoacoustic effect in molecules like
hemoglobin, melanin, water, cytochromes, DNA-RNA, and lipids, all found in human and animal tissue.
Optical absorption in the UV-Visible range leads to electronic excitation, followed by nonradiative
transitions, generating PA signals. Vibrational absorption at bond-specific laser wavelengths has also been
used for imaging [13]. Additionally, stimulated Raman absorption [14] and surface plasmon resonance
absorption [15] have been employed to generate PA signals for imaging biological tissue [16]. The principle
of PAT is illustrated in Fig. 7

Fig. 7. Absorbed photons produce local heating in the tissue after selective absorption by molecules in the tumor.
Photoacoustic excitation generates ultrasonic pressure waves detected by the array of ultrasonic transducers.
The PA signal processing results in the tissue image with the embedded tumor.
Tunable pulsed lasers with pulse energy above 10 mJ are required, allowing single pulses to
generate 2D or 3D images at pulse repetition rates of tens of hertz. Commonly used systems i
nclude Q-switched Nd pumped OPO, Ti:Sapphire, and dye lasers, which offer sufficient energy
with nanosecond pulse duration. As shown in Fig. 7, the conversion of optical heating into
acoustical energy is detected by ultrasonic detectors. PAT has several unique features:
It enables deeper tissue penetration than optical microscopy, with spatial resolution.
It provides histologic, metabolic and functional imaging via endogenous contrast, and
molecular/cellular imaging through exogenous contrast.
It is complementary to and compatible with optical and ultrasound imaging.
Compared to ultrasound imaging, photoacoustic imaging (PAI) offers functional and molecular sensitivity
based on optical absorption contrast, making it versatile for preclinical and clinical applications. PAI
systems fall into three categories: optical resolution photoacoustic microscopy (OR-PAM), acoustic
resolution photoacoustic microscopy (AR-PAM) and photoacoustic computed tomography (PACT) as
shown in Fig. 8. OR-PAM achieves high resolution (micron level) but limited to 1 mm depth. AR-PAM
allows deeper penetration with variable resolution based on transducer design. PACT provides rapid 2D
or 3D imaging using wide-field optical excitation and low-frequency transducers, offering sub-millimeter
resolutions.

Fig. 8 Representation of light-based medical imaging modalities: CFM (confocal microscopy), TPM
(two-photon microscopy), OR-PAM (optical resolution photoacoustic microscopy), AR (acoustic resolution
photoacoustic microscopy), and PACT (photoacoustic computed tomography). [Adapted from Ref # 16]
2.4.1 Functional photoacoustic microscopy
The use of photoacoustic microscopy by Zhang et al. [17] for imaging tumor angiogenesis in a live mouse,
is illustrated in Fig 9. A subcutaneously inoculated B16 melanoma in an immunocompromised nude
mouse was imaged at 584 nm and 764 nm. A maximum amplitude projection (MAP) image was formed
by projecting the maximum photoacoustic amplitudes onto an orthogonal plane. Fig. 9b shows a composite
of two MAP images along the z-axis, with blood vessels pseudo-colored red (584 nm) and melanoma
brown (764 nm). Six orders of vessel branching were observed indicated by numbers 1 to 6. Fig. 9c
displays 3D visualization, where the melanoma is 0.32 mm below the skin and its thickness 0.3 mm.
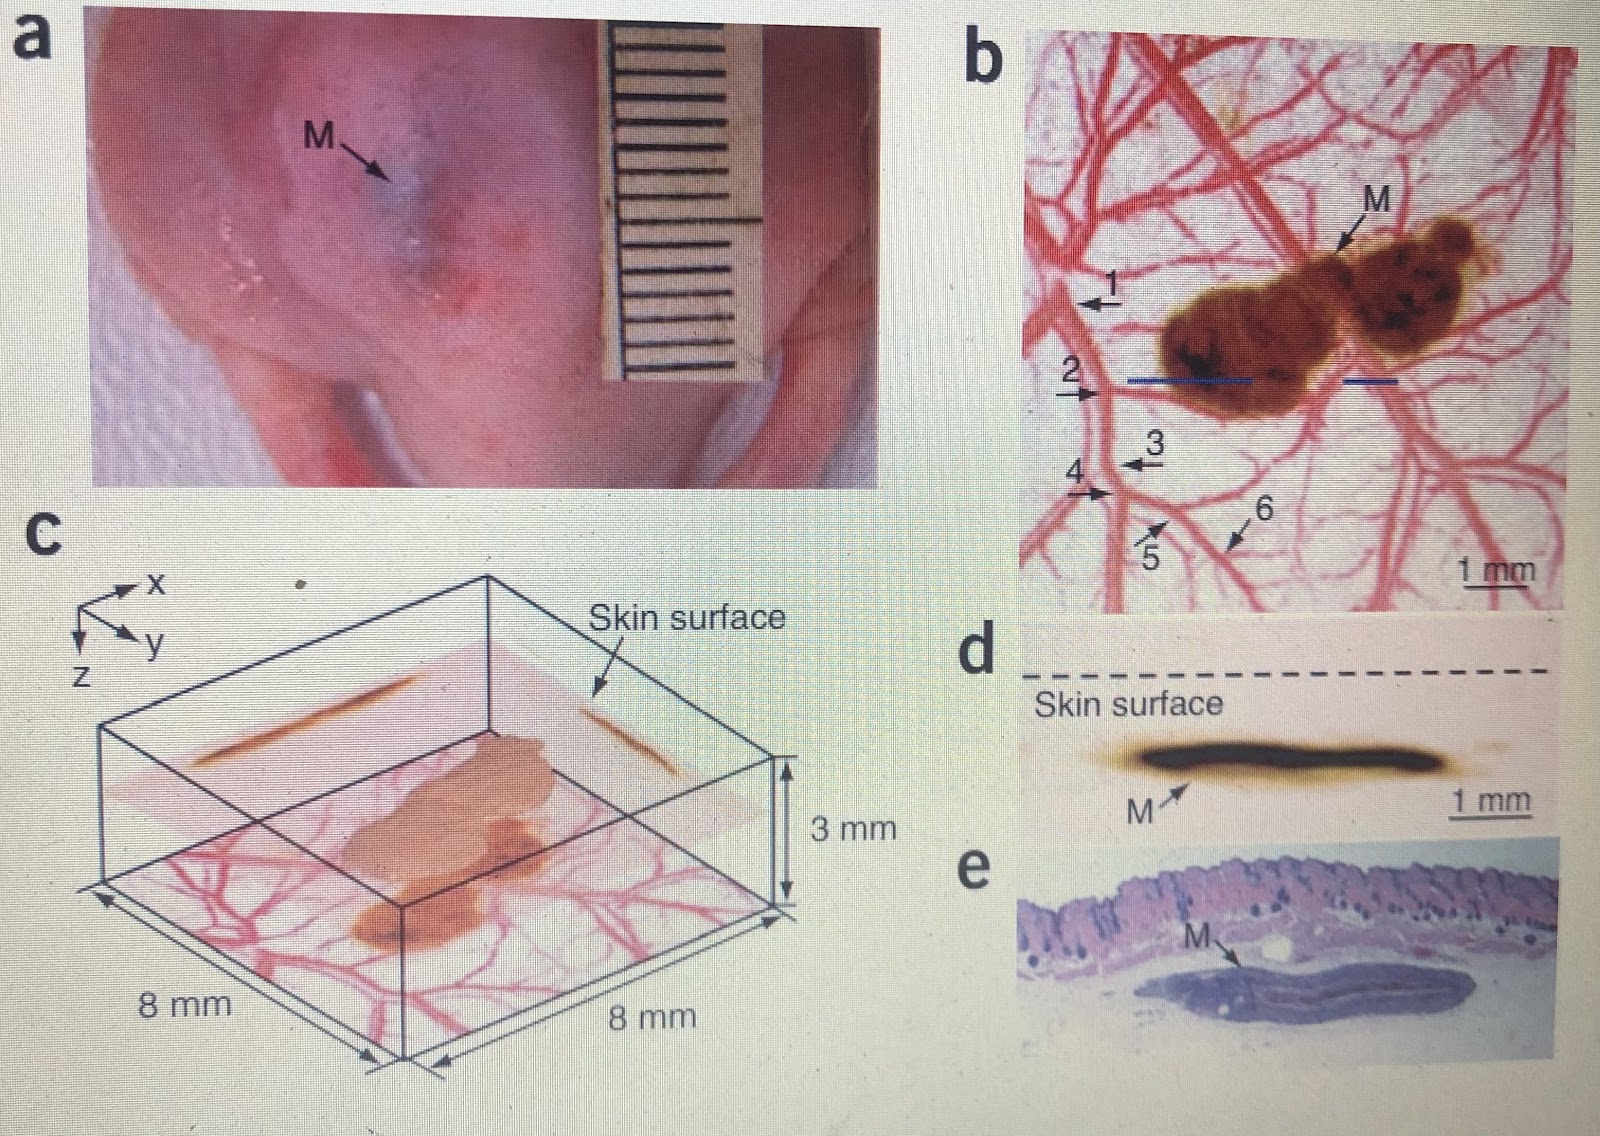
Fig. 9. (a) Photograph of the melanoma. (b) A composite of the two MAP images projected along the z axis. (c)
Three dimensional visualization of the melanoma. (d) A cross-sectional (B-scan) image of the melanoma parallel
with the z-x plane. (e) Hematoxylin-and-eosin (HE) stained section at the same location as in (d).
[Reproduced from Ref. 17 with permission]
2.4.2 PAM of human cutaneous microvasculature
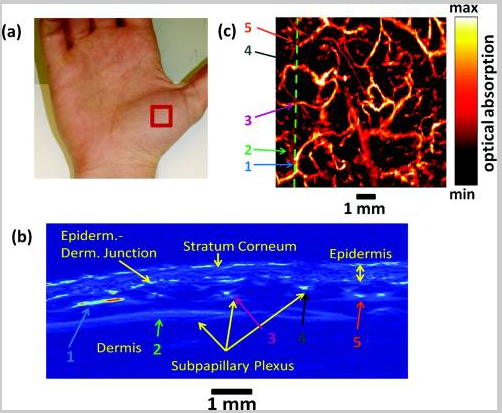
Fig. 10. (a) Photo of the palm with the imaged area in the box.
(b)B-scan PA image taken along the dotted line in (c) with notable features and selected vessels labeled with color
arrows for reference with the image in (c) . Maximum amplitude projection image taken from the palm using 584 nm excitation where the green dashed line
indicates the cross-section shown in (b). [ Reproduced with permission from Ref. 18]
Favazza et al. [18] used single laser excitation for photoacoustic microscopy (PAM) imaging of the palm.
A section of the base of the thumb was imaged at 584 nm, scanning an 8x8 mm2 area (see Fig.10a). A cross-sectional (B-scan) image, in Fig. 10b, shows strong PA signals from the skin
surface and underlying blood vessels. The image distinguishes the epidermis, stratum corneum, and
epidermal-dermal junction, which lies about 300 microns below the surface with a high concentration of
capillaries in agreement with other measurements [19,20]. Fig. 10c presents a 3D MAP image, removing
unresolved capillaries and the epidermal-dermal junction. The experiment highlights PAM’s ability to
assess the structure and function of human skin microvasculature in vivo.
3. PAS of gases and vapors emanating from the human body
Body odors are unique to individuals, influenced by factors like age, diet, metabolism, and health.
Common body odor comes from bacteria breaking down sweat into acids, not the bacteria itself. Odors
also emanate from breath, blood, and urine, revealing health conditions. Diseases can cause characteristic
smells: uncontrolled diabetes has a fruity odor, liver disease produces a fishy smell, kidney failure a
urine-like odor, and lung abscesses a putrid stench. Prolonged exposure to low levels of harmful gases
and vapors in hospitals or factories can lead to headache and fatigue.
Linus Pauling’s lab first identified hundreds of volatile organic compounds (VOCs) in human breath
at parts per billion (ppb) levels [21]. Breath analysis can be divided into two categories: studying
compounds produced naturally by the body due to physiological conditions and analyzing metabolites
after administration of a drug. Several VOCs serve as biomarkers for specific diseases, such as acetone
for Type 1 diabetes, formaldehyde for breast cancer, and alkanes for lung cancer. PA spectroscopy is
useful in breath-analysis and harmful gas detection.
3.1 PA detection of Nitric Oxide (NO)
Kreuzer and Patel [22] first used CO laser-based PA spectroscopy, nearly 50 years ago to detect NO at
0.01 ppmV. Detecting trace levels of nitric oxide (NO) is crucial for medical, biological and environmental
applications. In 1991, NO was found in exhaled air and later identified as a marker for asthmatic airway
inflammation [23,24], which is linked to various lung diseases. Elia et.al. [25] have developed a quantum
cascade laser (QCL)-based PA sensor with a microphone detector, and commercial systems achieved a
detection limit of 500 ppbV for NO. Spagnolo et al. [26] fabricated a quartz tuning fork (QTF)
detector-based PA cell, achieving a lower concentration limit of 15 ppbV.
3.2 PA detection of ethylene emanating from breath and skin
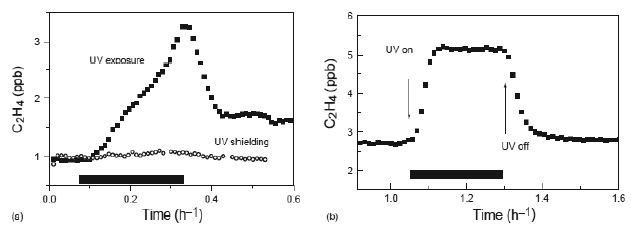
Fig. 11 Ethylene emission from human body after exposure to UV radiation: (a) Variation of ethylene production in
exhaled air. (b) Variation of ethylene production from skin. The thick black bar represents the duration of UV
exposure. [with permission from Ref. 27]
Harren et al. [27] demonstrated the ethylene (C2H4)
emission from human breath and skin under UV radiation using a CO2
laser for PA excitation. Before introducing exhaled air into the PA cell, it was cleaned of CO2, water and
other interfering gases. For skin measurements, a specially designed PA cell was placed on the skin, and
the 10P14 emission line of CO2
laser was used to monitor ethylene. The PA sensor had a detection limit of 6 ppbV ethylene in nitrogen.
UV radiation caused a steady increase in ethylene emission in exhaled air after 2 minutes, which decreased
after the UV source was turned off as shown in Fig. 11a. In the case of ethylene emission from skin,
a steady and constant production of ethylene was observed , immediately after the start of UV radiation as
shown in Fig. 11b.
3.3 PA detection of ammonia (NH3)
Ammonia plays a role in both normal and abnormal physiology. It is produced through normal amino acid
metabolism and converted to urea by the liver. In liver dysfunction, such as in cirrhosis, ammonia levels
in the blood can rise. Near-IR diode laser (1.53 μm) based PA sensors with microphone and QTF detectors
have been developed for detecting ammonia at ppmV and ppbV [28- 30]. These sensors use harmonic
These sensors use harmonic vibrational bands of ammonia molecule. Mid-IR QCL-based PA sensors
offer potentials for portable, lower-concentration detection using fundamental NH3 absorption bands.Normal breath ammonia ranges from 2 to 2.9 ppm is a biomarker of renal failure and oral diseases.
Narasimhan et al. [31] used a CO2
laser to measure breath ammonia, correlating it with blood urea nitrogen (BUN) and creatinine levels,which indicate kidney malfunction. Accurate measurements were possible within a minute.
3.4 PA spectroscopy of dangerous drugs
Morphine is the standard narcotic drug against which all other opioids are tested. Heroin, an acetylated
form of morphine, is nearly twice as potent. Both drugs are used for pain relief but are addictive and
illegal. Microgram quantities of morphine and heroin powders were studied in a PA cell with ZnSe window,
using a CO2 laser as the excitation source. The PA spectra of the compounds, shown in Fig. 12, were
recorded in the regions of 9.6 and 10.6 microns. The black dots represent PA signals normalized by laser
power, and the spectral peaks correspond to the vibrational bands of the two drug molecules.
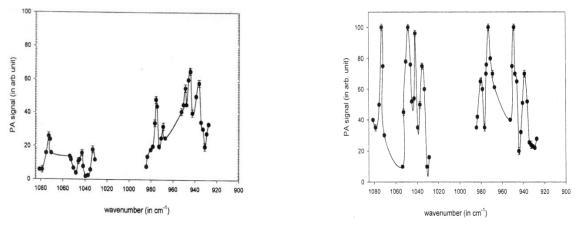
Fig. 12 CO2 laser excited PA spectra of powders of Heroin (on the left) and Morphine (on right) Morphine is the standard narcotic drug against which all other opioids are tested. Heroin, an acetylated form of morphine, is nearly twice as potent. Both
3.5 Diseases diagnosed by PAS of breath
Infectious diseases:
Respiratory infections, such as tuberculosis, may cause VOC patterns in the PAS of exhaled breath to detect
the relevant biomarkers enabling early, noninvasive diagnosis of infections. Research is underway to
determine biomarkers for viral infections, including COVID-19, offering a noninvasive and rapid
diagnostic method.Nitric oxide (NO) in breath is a well-known biomarker for airway inflammation in
asthma and chronic obstructive pulmonary disease (COPD).
Liver diseases:
PAS can detect elevated ammonia levels in exhaled breath, which can indicate liver dysfunction.
Thus, the technique can help in the diagnosis of conditions like liver cirrhosis or hepatic encephalopathy,
because the liver normally converts ammonia to urea. Different liver diseases may produce specific VOCs,
allowing for a more precise diagnosis through breath analysis
Lung diseases:
PAS detects VOCs like alkanes and aldehydes in the breath, which can serve as biomarkers
for lung cancer. The capability of the technique to detect molecules in very low concentrations, potentially
enabling early diagnosis. Breath-based PAS screening offers a low-cost noninvasive alternative to more
invasive procedures like biopsies and imaging.
Gastrointestinal disorders:
H. pylori is a bacterium linked to stomach ulcers and gastric cancer that produces
urease, which breaks down urea into ammonia and carbon dioxide. The detection of carbon dioxide in breath
after the administration of labeled urea helps the diagnosis of H. pylori infection. PAS can also detect elevated
hydrogen and methane levels in breath, indicative of SIBO, a condition where excess bacteria in the small
intestine interfere with digestion and absorption.
Diabetes:
Elevated acetone levels in breath are known indicators of ketosis, which is associated with poorly
controlled diabetes. Accurate detection of acetone by PAS offers a noninvasive way to monitor blood
glucose control. Similarly, the onset of diabetic ketoacidosis (DKA), a potentially life-threatening complication
of diabetes, can be detected by monitoring elevated acetone levels.
Kidney diseases:
PAS monitors ammonia and other VOCs in breath, which may be elevated in patients with
kidney dysfunction. This is helpful in the early diagnosis and monitoring of chronic kidney disease and
end-stage renal disease.
4. PAS of fluids in human body
Blood is a complex fluid in the human body, composed of water, cells, electrolytes, metabolites, proteins
and hormones. It permeates every organ where its interactions affect the blood as well as the organs. Blood
functions as a vehicle for transporting catabolic fuel, removing metabolic waste as well as in healing and
microbial defence. The analysis of this most important fluid can provide a great deal of information about
the physiological and pathophysiologic status of the body.
Blood tests need samples which are acquired by invasive and uncomfortable procedures. The laboratory
analysis of blood components involve chemical reactions and enzyme assays which can result in differences
from in-vivo environments. The small sample volume used in blood tests makes it difficult to detect
circulating tumor cells in early metastasis.
Hemoglobin molecules, in the red blood cells, transport oxygen from the lungs to tissues throughout
the body and transport carbon dioxide from the tissues back to the lungs. Hemoglobin undergoes a
conformational change to allow subsequent oxygen's to bind, so that each oxygen that binds to hemoglobin
increases its affinity to bind more oxygen. Hemoglobin plays a crucial role in oxygen saturation by acting
as the primary protein in red blood cells responsible for binding and transporting oxygen molecules
throughout the body. The percentage of hemoglobin molecules currently occupied by oxygen measures the
level of oxygen saturation (sO2). The absorption characteristics of hemoglobin (Hb) and oxyhemoglobin
(HbO2) are very different in the visible and near-infrared spectral regions as shown in Figs. 13a and 13b
respectively. In photoacoustic spectroscopy Hb and HbO2 serve the role of indigenous detectors for
noninvasive diagnosis of several diseases. The absorption spectra of the skin pigment, melanin, is also
shown in Fig. 13b, which is another indigenous molecule used in photoacoustic diagnosis of diseases. In
the following sections we will discuss some examples of using body fluids in disease diagnosis.
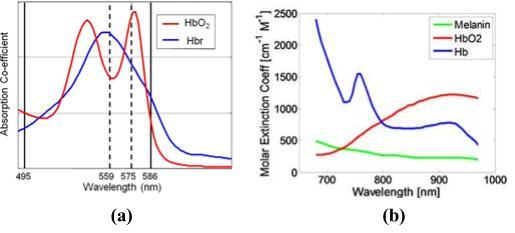
Fig. 13(a) Visible absorption spectra of oxyhemoglobin (HbO2), and deoxyhemoglobin (Hb).
(b) Near infrared absorption spectra of HbO2, Hb, and melanin.
4.1 Photoacoustic detection of circulating tumor cells
Invasive extraction of cells from a living system may alter their properties in their natural environment.
Other limitations include low sensitivity for detection of rare circulating tumor cells (CTCs), bacteria,
sickle cells and clots due to small blood sample volumes, and the discontinuity of sampling at limited time
points. These shortcomings can be addressed by developing in vivoflow cytometry, which allows for noninvasive, continuous monitoring of large blood volumes in the blood
vessels.PA flow cytometry (PAFC) is a technique where cells pass through a pulsed laser and sensor, generating a
corresponding PA signal, as illustrated in Fig. 14. In vivo PA detection flow cytometry has been used for
detecting rare circulating tumor cells (CTC) in mouse models [33, 34]. It is based on the irradiation of
selected blood vessels using short laser pulses followed by time-resolved detection of the PA signals with
an ultrasound transducer gently held against the skin (see Fig. 1A right). Fig. 1B illustrates a typical PA
signal trace that occurred during label-free detection of melanoma CTCs (B16F10) on the tumor-bearing
mouse model. Each individual peak in this trace, obtained by averaging many PA signals (20–100), is
associated with individual single or aggregated CTCs. Metastasis responsible for most cancer deaths,
Metastasisn tumor cells spread to distant body sites. These circulating tumor cells (CTCs) have a shedding rate estimated at 3.2 million cells per gram of tumor daily. Most CTCs are rapidly cleared, but
those that survive may have higher metastatic potential, leading to a poorer prognosis. Detecting CTCs
could provide improvement in cancer treatment, and preventing metastasis by CTC-targeted treatment
could improve cancer treatment, and targeting CTCs might prevent metastasis, reducing the need for
systemic treatment and improving patient outcomes. Studies show that CTCs are valuable markers for
metastasis, cancer occurrence, and therapy effectiveness.
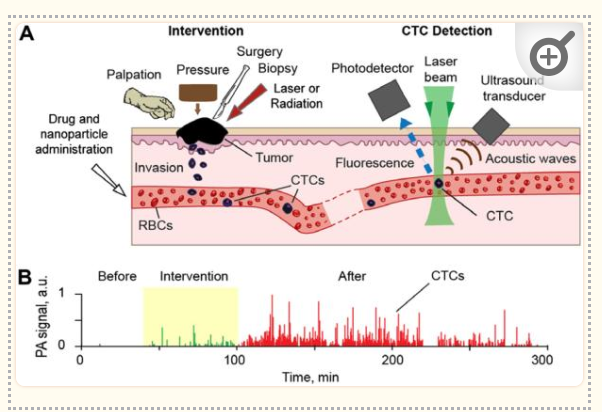
Fig. 14 In vivo integrated PA and fluorescence flow cytometry. (A) Schematic for simultaneous detection of
circulating cells (CTC) with both absorption and fluorescence properties (right) during diagnostic and therapeutic
interventions (left). (B) Example of a PA signal trace produced by melanoma CTCs (B16F10-GFP) in micro-vessels
of the mouse ear before, during, and after pressure (120 g) applied on about 5 mm skin tumor. [Adapted from Ref. 34]
4.2 Photoacoustic detection of malaria
Malaria is caused by a parasite that depends on red blood cells (RBCs) as hosts. Early diagnosis and
complete elimination of the infection are crucial for treating this disease, which affects approximately
230 millions people annually [35]. Current diagnosis methods involve invasive blood sampling and require
high-resolution microscopy performed by experienced diagnosticians, which are often unavailable in the
regions most affected by malaria. To improve diagnosis, various methods have been explored, including
photoacoustic detection [36].
The malaria parasite follows a cycle of infecting RBCs, reproducing, rupturing the cells, and spreading to
new cells. During the merozoite stage, the parasite breaks down hemoglobin producing a byproduct called
hemozoin, which generates a strong photoacoustic (PA) signal making it a useful marker for detecting
malaria) [37].
In PA flow cytometry (PAFC), each RBC is analyzed for the presence of hemozoin, which indicatesmalaria infection. The traditional method for detecting malaria, the optical thick blood film, has a detection
limit of around 50 parasites per microliter of blood [38]. However, PAFC has been shown to detect malaria
at a much lower limit- about one parasite per 0.16 mL of blood, significantly improving sensitivity [4].
Additionally, Menyaev et al. [5] have demonstrated a similar low detection limit in in-vivo systems, further
validating the effectiveness of PAFC for malaria detection..

Fig. 15 Schematic representation of Photoacoustic flow cytometry for the detection of malaria. [Adapted from Ref. 36]
The use of hemozoin in PA detection for malaria diagnosis has a limitation because hemozoin is only
produced when the parasite matures from the sporozoite stage to the merozoite stage in the liver.
Nevertheless, optoacoustics offers a promising methodology for high-quality, non-invasive, and
automatable processes for malaria diagnosis and monitoring. Further studies are needed to advance this
field.
5. PAI to look inside the tissues
Medical imaging aims to capture physiological processes in organs, tissues or cells to diagnose disease or
evaluate effectiveness of therapy. Techniques like magnetic resonance imaging (MRI), computed
tomography (CT), positron emission tomography (PET) and ultrasound are commonly used, but few can
monitor real-time processes without external contrast agents [39]. Photoacoustic imaging (PAI) fills this
gap by integrating with ultrasound systems and imaging endogenous chromophores like hemoglobin or
melanin, offering the resolution of light-based imaging with the depth of sound-based imaging [40].In recent years, PA imaging has grown due to its non-ionizing nature, cost-effectiveness, and ability to
provide sufficient resolution for assessing tissues and therapies. It can use endogenous contrast
(like hemoglobin) or exogenous agents to enhance imaging. PA imaging is based on ultrasound waves
generated by light absorption from pulsed lasers [41,42]. It has been shown to detect cancer, cardiovascular
diseases and guide surgeries [43-49]
PA imaging relies on wavelength selective optical absorption of chromophores, distinguishing them by
tuning the laser to match their spectral absorption peak. Hemoglobin’s ability to absorb visible and
near-infrared light allows PAI to distinguish between vascular and nonvascular tissues, overlaying
physiological structures with vascular details in a single system. It can also monitor tissue temperature
during thermal therapies and help prevent nerve damage in surgical nerve blocks by clearly distinguishing
nerves from surrounding tissues [50].
5.1 Ultrasound and photoacoustic imaging of breast cancer
The breast cancer diagnostic methods are dominated by mammography, although there are drawbacks of
mammography including ionizing radiation and patient discomfort. Ultrasound (US) is another method
for diagnosis of breast cancer, commonly performed on women with dense breasts. The wavelength
dependent nature of PA imaging provides spectroscopic imaging to generate quantitative information
such as oxygen saturation (sO2) which is an important indicator in cancer progression. Thus, PA imaging
is a powerful adjunct to US imaging, and provides more indicators that can be used to form a potentially
more informed diagnosis in the progression of cancer and its treatment. Kratkiewicz et al. [51] have
discussed several PA imaging systems along with their advantages and disadvantages in breast cancer
diagnosis. In the following sections three of the important systems are described to provide a landscape
of possible intersections and future refinements in cancer diagnosis.
5.1.1 Photoacoustic computed tomography (PACT)
Photoacoustic Computed Tomography (PACT) allows ultrasonic imaging of optical contrast surpassing
the 1 mm optical diffusion limit that typically restricts high-resolution optical imaging in deep tissues.
PACT combines the functional optical contrast of diffuse optical tomography with the high spatial
resolution of ultrasonography. This rich optical absorption contrast enables PACT to perform structural,
functional, and molecular imaging.
For breast imaging, PACT leverages these advantages, offering high spatial and temporal resolution with
deep, non-ionizing optical penetration. Hemoglobin, the main optical absorber in the near-infrared range,
provides endogenous contrast., allowing blood vessel imaging. Since a high density of blood vessels often
correlates with angiogenesis - a critical factor in tumor growth and metastasis– PACT is especially useful
for detecting such changes.
However, there are five key challenges to clinical adoption of PACT for breast imaging:
Achieving sufficient penetration depth to accommodate different breast sizes and skin tones.
Ensuring high spatial resolution to reveal detailed angiographic structures.
Providing high temporal resolution to reduce motion artifacts and allow for dynamic or functional studies.
Minimizing limited-view artifacts
Achieving sufficient noise-equivalent sensitivity and contrast-to-noise ratio to detect breast masses accurately.
Prof. L.V. Wang’s research group was one of the first to overcome the limitations mentioned above by
developing a breast imaging technique known as single-breath-hold PACT (SBH-PACT). This modality
has successfully revealed the anatomy and dynamics of a healthy breast [52].
As shown in Fig. 16, the imaging system uses a 1064 nm laser to irradiate the target, along with a 2.25
MHz unfocused full-ring 512 element ultrasonic transducer. This combination addresses the challenges
of penetration depth and spatial resolution. The system achieves an in vivo imaging depth up to 4 cm and
an in-plane resolution of 225 microns - about four times finer than that of contrast-enhanced MRI.
Additionally, SBH-PACT features one-to-one signal amplification and data acquisition (DAQ) circuits,
which eliminates the third limitation by capturing an entire 2D cross-sectional breast image with a single
laser pulse.

Fig. 16 (a) Overview of the SBH-PACT system, (b) Perspective view of the system with patient bed and optical components removed. (c) X-ray and PA images of a 44-year old female patient with a fibroadenoma in the right breast- (i) X-ray mammograms of the affected breasts, (ii) Depth-encoded angiograms, (iii) Maximum amplitude projection images of thick slices in sagittal planes marked by white dashed-lines in (ii), (iv) Automatic tumor detection on vessel density map, and (v) PA elastography images. [Adapted from Ref # 51 and 52]A volumetric 3D image of an entire breast cancer can be captured through rapid elevational scanning within a single breath-hold of about 15 seconds. With a 10 Hz 2D frame rate SBH-PACT can monitor biological dynamics in cross-sections, such as those associated with respiration and heartbeats, without introducing motion artifacts. By utilizing optimized illumination, SBH-PACT achieves sufficient sensitivity to clearly display angiographic structures both within and around breast tumors, all without the need for exogenous contrast agents.
In a pilot study [52], SBH-PACT was used to image one healthy individual and seven breast cancer
patients. The system successfully identified eight of the nine tumors by visualizing the angiographic
anatomy, with these findings later confirmed through ultrasound-guided biopsies. An algorithm was
developed to automatically highlight tumors, enhancing image interpretation. SBH-PACT could distinguish
between arteries and veins by detecting blood flow-induced arterial deformation synchronized with the
heartbeat.
5.1.2 Tomography with Twente Photoacoustic Mammoscope 2
Researchers at the University of Twente developed a photoacoustic breast imaging system using a
tomographic setup as shown in Fig. 17 [53]. In the system, a single breast is imaged while the woman
lies prone with her breast positioned inside a water-filled imaging tank. A dual-head laser
(755 and 1064 nm) illuminates the breast, with one beam directed at the nipple and nine others aimed
at the sides. Ultrasound signals are captured by 12 arc-shaped arrays, each containing 32 piezocomposite
elements with a center frequency of 1 MHz. The tank and transducer arrays rotate to gather multiple
projections, and 3D images are reconstructed using a filtered back-projection algorithm.

Fig. 17 (a) Schematic of the Twente PAM 2 imaging tank. (b) Photograph of the Twente photoacoustic mammography
(PAM) 2 system where (i) marks the imaging tank. (c ) Local maximum intensity projections of the breast in the (i)
sagittal and (ii) transverse plane. [Adapted from Ref # 51 and 53]
In a preliminary study, breasts involving two healthy volunteers, the system successfully imaged breast contours, the nipple, and vascular anatomy with 1 mm resolution. This ability to visualize the vessel network in healthy tissues raises expectations for detecting regions with higher vessel densities, which may help identify breast cancer.
The system known as PAM 2 was developed to noninvasively image breast vascularity and detect cancer by visualizing tumor-induced disorganized blood vessel networks. Since it can capture detailed vessel structures in healthy individuals, it holds potential for identifying areas with higher vessel density, aiding cancer detection. Images obtained at 755 nm and 1064 nm show good anatomical alignment, enabling the analysis of oxygen saturation (sO2) due to the isosbestic point of oxyhemoglobin and deoxyhemoglobin near 800 nm.
5.1.3 Imagio for PA imaging of breast cancer

Fig. 18 (a)
Schematic diagram of the Imagio system: Tissue (TS), skin (SK), scattered light (SL), optical beams (OB),
fiber bundles (FB), light diffusers (LD), optical window (OW), acoustic waves (AW), blood vessels or tumors
(BV or TM), acoustic lens (AL), transducer (TR), electric cables (EC), backing material (BM).
(b) Illustration shows that laser light emitted at wavelengths corresponding to absorption peaks of oxygenated and
deoxygenated hemoglobin produces acoustic signals that can then be used to reconstruct oxygen saturation maps.
(c) An example of combined ultrasound/photoacoustic images of breast carcinoma—(i) An ultrasound gray scale image of a 2.6 cm malignant mass, (ii) regions of increased total hemoglobin, and
(iii) oxygenation map where red are regions below an average oxygen saturation of 85% while green are normally
oxygenated regions (>90% sO2). [Adapted from Ref # 51, 55 and 56]
Imagio, developed by Seno Medical and shown in Fig. 18, is the first PA imaging system to receive the
premarket approval from the Food and Drug Administration (FDA) [54,55]. Unlike the two PA imaging
systems described above, it features a handheld ultrasound and photoacoustic probe with an integrated
optical fiber bundle as shown in Fig. 18. Imagio uses a dual-wavelength laser: a 1064 nm Nd laser with
a 15 ns pulse width and 150 mJ energy, and a 757 nm Alexandrite laser with a 50 ns pulse width and
140 mJ energy. To minimize motion artifacts, the system switches between wavelengths with a 5 ms
delay. The laser beams are delivered via a 200-micron optical fiber bundle, uniformly distributed across The 40 mm x 6 mm optical windows that include custom lenses and diffusers. The combined ultrasound and
photoacoustic (US/PA) probe is optimized for imaging tumors around 10 mm in size but can visualize
objects between 3 to 20 mm and large blood vessels at depths up to 40 mm. Imagio also reconstructs
real-time US/PA images for immediate diagnosis [54-57]. The Imagio system and the combined US/PS
images obtained from it are illustrated in Fig. 18.
5.2 Exogenous contrast agents for photoacoustic molecular imaging of breast cancer
The PA systems described in the preceding sections use oxygenated and deoxygenated hemoglobin as
endogenous contrast agents during imaging. This is crucial for tracking vascular transformation as the
disease progresses. The ability of PA imaging to leverage endogenous contrast agents to derive quantitative
information on disease or pathology progression is highly valuable. However, when background noise
levels are too high, or when it is difficult to distinguish the region-of-interest in the breast from surrounding
tissue, exogenous contrast agents can be conjugated and targeted to illuminate specific cancer sites or other
pathologies, potentially increasing the sensitivity and specificity of PA imaging. This adaptability makes
PA an extremely versatile imaging modality and a powerful adjunct to ultrasound (US), enabling a
combined system to provide physicians with invaluable insights into disease progression and screening. Exogenous contrast agents have two main advantages over endogenous ones. First, the chemical and
optical properties of exogenous contrast agents can be specifically engineered for optimal detection.
Second, exogenous agents can be conjugated with targeting molecules, such as antibodies, to selectively
bind to disease-specific cell surface receptors. Organic dyes, nanoparticles, and carbon nanotubes have all
been used as contrast agents.
One example of an exogenous contrast-enhancing agent is indocyanine green (ICG) conjugates. When
bound to an antibody, ICG can undergo dynamic spectral shifts after endocytosis and degradation [58].
This property can be used to differentiate normal breast tissue from cancerous tissue by targeting receptors
expressed on tumor cells. Another FDA-approved exogenous contrast agent is methylene blue, which
accumulates in tumors due to its small size and its ability to bind to both endothelial and epithelial cell
surface receptors [59]. Methylene blue has been used for imaging sentinel lymph nodes (SLNs), the first
nodes in the lymphatic system that drain a tumor site. A negative SLN biopsy result typically suggests that
cancer has not spread to nearby lymph nodes or other organs. PA imaging can determine if a lymph node is
an SLN by detecting accumulated blue dye.
Nanoparticles can be made from various materials and manufactured into different shapes. For example,
gold nanospheres have a peak absorption around 520 nm, which falls within a local minimum in the optical
window of both blood and skin [60,61]. Single-walled carbon nanotubes (SWNTs) also serve as contrast
enhancing agents with a wide absorption spectrum, outside the visible spectrum up to 3 GHz [62]
5.3 PA-guided breast lumpectomy
Resection surgery is a procedure that removes diseased or cancerous tissue from an organ.
Breast-conserving surgery involves removing a tumor while minimizing the removal of surrounding
healthy tissue. The extent of resection is determined by the negative margins observed during histological
evaluation. To minimize the likelihood of tumor recurrence, proper orientation is crucial to excise the
smallest possible amount of healthy tissue
Raman spectroscopy has been used for examining the tumor resection cavity [63] because it provides
detailed molecular and biochemical information about the tissue. However, the long scan times make it
impractical for clinical settings. In contrast, PA imaging can be acquired instantaneously alongside
ultrasound (US) images. The ability of PA imaging to obtain real-time information on various
chromophores, such as blood, cytochrome, nuclei, and lipids, at different wavelengths makes it useful for
visualizing tumor and non-tumor regions before, during, and after surgical procedures [63-66]. Compared to H&E staining used in histological imaging, PA imaging in the UV wavelength range can
resolve individual cell nuclei and provide a contrast level similar to conventional histological imaging
[67]. Thus, PA imaging offers a label-free method (without the use of exogenous agents) for confirming
successful tumoral excisions following surgery.
5.4 Diagnosis of liver disease by PAI
Photoacoustic imaging (PAI) studies on murine model disease have emerged to provide a promising
non-invasive modality for assessment of liver disease. PAI can evaluate hepatic vascular network, which
is vital for liver health providing the necessary nutrients and oxygen [68]. Disruption in vascular structure
and oxygen metabolism indicate liver damage and impaired liver function reserve (LFR), which is a critical
parameter for assessing disease severity and predicting patient outcomes.
Non-alcoholic fatty liver disease (NAFLD) is an umbrella term referring to a group of conditions
associated with fat deposition and damage of liver tissue. Early detection of fat accumulation is essential
to avoid progression of NAFLD to serious pathological stages such as liver cirrhosis and hepatocellular
carcinoma. Multi-modal transmission-reflection optoacoustic ultrasound (TROPUS) is a versatile imaging
approach for multi-parametric anatomical, functional and molecular characterization of murine disease
models[69,70Exvivo imaging has to be performed for validation of the quantitative readings provided by TROPUS,
to enable the differentiation between the diseased and normal liver. For this purpose cross-sectional images
from two different slices are acquired by vertically shifting the electronically control with a 1 mm step size.
5.5 Gastrointestinal imaging
Inflammatory bowel diseases, such as Crohn’s disease (CD) require accurate and objective
Methods to assess the risk of relapses and associated complications. The current colonoscopy-based
approach, although effective, is time consuming and carries several risks. In this context, the hand-held
MOST system offers a promising alternative, providing a rapid and noninvasive method to extract
functional information from the colon for objectively assessing the severity of CD [71]
5.6 Musculoskeletal imaging
Inflammatory arthritis encompasses diseases characterized by joint inflammation, often affecting other
tissues. The high-resolution optical contrast of PAI has been used to map cartilage, vascularity, synovium
and bone tissue in human joints. Berg et al. [72] introduced a portable PA/US imaging system with a
hand-held linear probe for imaging synovitis in rheumatoid arthritis patients and healthy controls.
Jo et al. [73] developed a PA/US dual-modality system with a tunable dye laser to identify inflamed finger
joints by quantifying inflammation-related hyperemia and hypoxia and hypoxia compared to healthy
subjects.
5.7 Carotid vessel imaging
Carotid artery disease is a prevalent form of heart disease. In an early demonstration of noninvasive PAI
for carotid imaging, Dima et al. [74] developed a PAI system with linear and curved ultrasound array
probes. Using the curved array on a healthy subject’s lower right neck, they visualized the right common
artery up to 18 mm beneath the skin along with the internal and external jugular veins. PAI images were
validated using DUS from the same location. A hybrid approach combining MOST, pulse-echo US, and
color Doppler imaging provided simultaneous blood flow and sO2 measurements [75]. Vascular structures
appeared due to hemoglobin contrast in MOST images and as hyperechoic in US images, distinguishing
sO2 levels 10-20 mm below the skin in the carotid space.
6. Future prospects of photoacoustics as a diagnostic tool
PAS and PAI provide structural, functional, molecular, and kinetic insights into biological tissue, with PAI
showing significant promise in preclinical and clinical applications. Clinical PAI systems, mainly
prototypes from academic institutions, produce varying images due to factors like laser power and image
acquisition methods. To address this, Bohndiek et al. [76] formed IPASC, a consortium to develop best
practice guidelines for image acquisition, analysis, and reporting. Standardized validation is essential for
verifying PAI system robustness. Adapting PAI systems to be portable and economical is a key to gain
their widespread use in the clinics [77]. Efforts to make PAI systems portable and affordable include
exploring low-cost LEDs as an alternative to expensive lasers [78,79]. However, LEDs’ large pulse width,
low power, and lack of tunability limit their use, particularly in PA spectroscopic applications.
Multispectral PAI has been utilized in preclinical studies to analyze placental, fetal and maternal
sO2 levels in normal and pathological pregnancies associated with pregnancy-related diseases [80,81].
High-resolution imaging of cervical microvasculature, down to capillary level resolution, has been
achieved using transvaginal PA endoscopy [82]. This transvaginal detector also shows potential for
in vivo ovarian imaging and detecting ovarian cancer [83].
PAI is being explored for studying neural activity and cognitive functions in the brain. Advances in
wavefront shaping are improving PAI’s penetration depth through turbid media, such as the skull [84,85].
Beard et al. [86] developed a portable, fully optical OPAI system that uses a fiber-coupled laser and a
Fabry-Perot sensor for acoustic detection. This system enables volumetric imaging of acoustically small
structures with high sensitivity, offering spatial resolution of 75-125 microns. It has also demonstrated the
ability to detect thermally induced peripheral vasoconstriction, making it a promising tool for patients with
prevascular diseases.
Clinical adoption of PAI systems hinges on balancing advanced functionality with ease of use.
Integrating PAI with other clinical imaging modalities, such as MRI and OCT, can streamline workflows.
While combining PAI with other optical systems is relatively straightforward, integration with MRI poses
challenges. Including the need for algorithms to align PAI molecular data with MRI images using mutual
fiducial markers [87].
7.Conclusion
Photoacoustics, encompassing photoacoustic spectroscopy (PAS) and photoacoustic imaging (PAI),
enables the analysis of gases, liquids and solids, and biological samples with minimal preparation.
Combining optical and ultrasound techniques, it provides high-resolution, deep-tissue imaging, making
it invaluable for noninvasive medical diagnostics without harmful ionizing radiation.
Applications include disease diagnosis through spectroscopic analysis of tissues and fluids, with
multispectral PAI often integrated with modalities like MRI and OCT. While advancements have enhanced
its diagnostic, treatment and monitoring capabilities, current systems face challenges such as slow image
reconstruction and spectral unmixing algorithms. Refining these processes to improve speed and usability,
akin to conventional ultrasonography, could boost clinician confidence. Additionally, artificial intelligence
(AI) holds promise for transforming PAI data into clinically actionable insights, enhancing real-time
functional diagnostics.
Reference
.
A.G. Bell, On the production and reproduction of sound by light, Am. J. Sci. 20 (1880) 305
A.G. Bell, The production of sound by radiant energy, Phil. Mag. 11 (1881) 510
A. Rosencwaig, A. Gersho 'Theory of photoacoustic effect with solids', Journal of Applied Physics, 47 (1976) 64
S.N. Thakur, Bulletin Laser and Spectroscopy Soc. (India) 7 (1993) 3
R. Klenze, R. Stumpe and J.I. Kim, in P Hess, J. Pelzl (Eds.) Photoacoustic & Photothermal Phenomena, Springer-Verlag, Heidelberg (1988) p.130
E. Russo, D. Rojas, P.B. Robouch and R.J. Silva, Remote photoacoustic measurements in aqueous solutions using optical fiber, Rev. Sci. Instrum. 61 (1990) 3729
J.I. Kim, Actinide colloid generation in groundwater, Radiochim. Acta 52/53 (1991) 71
G. Paltauf and H. Schmidt-Kloiber, Model study to investigate the contribution of spallation to pulsed laser ablation of tissue, Lasers Surg. Med. 16 (1995) 310
R.S. Dingus and R.J. Scammon, Griineeisen-stress induced ablation of biological tissue, Proc. SPIE 1427 (1991) 45
L.V. Zhigilei and B.J. Garrison, Microscopic mechanisms of laser ablation of organic solids in thermal and stress confinement irradiation regimes, J. Appl. Phys. 88 (2000) 1281
R.R. Anderson and J.A. Parrish, Selective photothermolysis: precise microsurgery by selective absorption of Pulsed radiation, Science 220 (1983) 524
D. Albagli, L.T. Perelman, G.S. Janes, C. von Rosenberg, I. Itzkan and M.S. Field, inertial confined ablation of biological tissue, Lasers Life Sc. 6 (1994) 55
H-W. Wang, N. Chai, P. Wang, S. Hu, W. Dou, D. Umulis, L. V. Wang, M. Sturek, R. Lucht, and J-X. Cheng, Label-free bond-selective imaging by listening to vibrationally excited molecules, Phys. Rev. Lett. 106 (2011) 238106
V.V. Yakovlev, H.F. Zhang, G.D. Noojin, M.L. Denton, R.J. Thomas, and M.O. Scully, Stimulated Raman photoacoustic imaging, Proc. Natl. Acad. Sci. USA 107 (2010) 20335
A. de la Zerda, J.W. Kim, E.I. Galanzha, S.S. Gambhir, and V.P. Zharov, Advanced contrast nano agents for photoacoustic molecular imaging, cytometry, blood test and photothermal theranostics, Contrast Media Mol. Imaging 6 (2011) 346
L.V. Wang and J. Yao, A practical guide to photoacoustic tomography in the life sciences, Nature Methods 13 (2016) 627
H.F. Zhang, K. Maslov, G. Stoica and L.V. Wang, Functional photoacoustic microscopy for high-resolution and noninvasive in vivo imaging, Nature Biotechnology 24 (2006) 848
C.P, Favazza, O. Jassim, L.A. Cornelius, L.V. Wang, In vivo photoacoustic microscopy of human cutaneous microvasculature, J. Biomed. Opt. 16 (2011) 016015
M.Mogensen, H.A. Morsy, L. Thrane, and G.B.E. Jemec, Morphology and epidermal thickness of normal skin imaged by optical coherence tomography, Dermatology (Basel, Switz.) 217 (2008) 14
S. Nouveau-Richard, M. Monot, P. Bastien, and O. de Lacharriere, In vivo epidermal thickness measurement: ultrasound vs. confocal imaging, Skin Res. Technol. 10 (2004) 136
L. Pauling, A.B. Robinson, R. Teranishi, P. Cary, Quantitative analysis of urine vapor and breath by gas-liquid partition chromatography, Proc. Nat. Acad. Sci. USA 68 (1971) 2374
L.B. Kreuzer and C.K.N. Patel, Nitric oxide air pollution: detection by optoacoustic spectroscopy, Science 173 (1971) 45
L.E. Gustaffson, A.M. Leone, M.G. Persson, N.P. Wikuld, S. Moncada, Endogenous nitric oxide is present in the exhaled air of rabbits, guinea pigs and humans, Biochem. Biophys. Res. Commun. 181 (1991) 852
M.J. Lanz, D.Y.M. Leung, D.R. McCormick, R. Harbeck, S.J. Szefler, C.W. White, Comparison of exhaled nitric oxide, serum eosinophilic cationic protein and soluble interleukin-2 receptor in exacerbations of pediatric asthma, Pediatr. Pulmonol. 24 (1997) 305
A. Elia, P.M. Lugara, C. Giancaspro, Photoacoustic detection of nitric oxide by use of a quantum-cascade laser, Opt. Lett. 30 (2005) 988
V. Spagnolo, A.A. Kosterev, L. Dong, R. Lewicki, F.K. Tittel, NO trace gas sensor based on quartz-enhanced photoacoustic spectroscopy and external cavity quantum-cascade laser Appl. Phys. B100 (2010) 125
F.J.M. Harren, G. Cotti. J. Oomens and S.te Lintel Hekkert, Photoacoustic spectroscopy in trace gas monitoring, in Encyclopedia of Analytical Chemistry, R.A. Meyers (Ed.), John Wiley (2000) pp 2203
A. Schmohl, A. Miklos and P. Hess, Detection of ammonia by photoacoustic spectroscopy with semiconductor lasers, Appl. Optics 41 (2002) 1815
A.A. Kosterev and F.K. Tittel, Ammonia detection by use of quartz-enhanced photoacoustic spectroscopy with a near-IR telecommunication diode laser, Appl. Optics 43 (2004) 6212
G.R. Lima, L. Mota, A. Miklos, J. Angster, Z. Dubovski. M.G. da Silva, M. Sthel, H. Vargas, Sensitive harmonic detection of ammonia trace using a compact photoacoustic resonator at double-pass configuration and a wavelength-modulated distributed feedback diode laser, Appl. Phys. B117 (2014) 333
L.R. Narasimhan, W. Goodman, C.K.N. Patel, Correlation of breath ammonia with blood urea nitrogen and creatinine during hemodialysis, Proc. Nat. Acad. Sci. USA 98 (2001) 4617
R.L. Prasad, S.N. Thakur and G.C. Bhar, CO2 laser photoacoustic spectra and vibrational modes of heroin, morphine and narcotine.
E.I Galanzha, V.P. Zharov, Circulating tumor cell detection and capture by photoacoustic flow cytometry in vivo and ex vivo, Cancers 5 (2013) 1691
J. Mazen, E.I. Galanzha, M. Sarimollaoglu, D.A. Nedosekin, J.Y. Suen, V.P. Zharov, In vivo detection of circulating cells during tumor manipulation, SPIE Photonics Therapeutics and Diagnostics IX 8565 (2013) 336
Malaria. n.d. https://www.who.int/news-room/fact-sheets/detail/malaria.
C. Cai, K.A. Carey, D.A. Nedosekin, Y.A. Menyaev, M. Sarimollaoglu, E I. Galanzha, et al., In vivo photoacoustic flow cytometry for early malaria diagnosis. Cytometry 89 (2016) 531
Y.A. Menyaev, K.A. Carey, D.A. Nedosekin, M. Sarimollaoglu, E.I. Galanzha, J.S. Stumhofer, et al., Preclinical photoacoustic models: application for ultrasensitive single cell malaria diagnosis in large vein and artery. Biomed Opt Express 7 (2016) 3643
A. Trampuz, M. Jereb, I. Muzlovic, R.M. Prabhu, Clinical review: severe malaria. Crit Care 7 (2003
A.L Klibanov, J.A. Hossack, Ultrasound in radiology: from anatomic, functional, molecular imaging to drug delivery and image-guided therapy. Invest Radio. 50 (2015) 657
L.V. Wang, S. Hu, Photoacoustic tomography: in vivo imaging from organelles to organs. Science 335 (2012) 1458
M. Xu, L.V Wang, Photoacoustic imaging in biomedicine. Rev. Sci. Instrum. 77 (2006) 041101
M.E. van Raali, M. Lee, E. Cherin, B. Stefanivic, F.S. Foster, Femtosecond Photoacoustics: integrated two-photon fluorescence and photoacoustic microscopy, Proc. SPIE 7564 Photons Plus Ultrasound: Imaging and sensing (2010) 75642E
M. Mehrmohammadi, S.J. Yoon, D. Yeager and S.Y. Emelianov, Photoacoustic imaging for cancer detection and staging. Mol. Imag. 2 (2013) 89
P. Sun, X. Wang, G. Wang, W. Deng, Q. Shen, R. Jiang, W. Wang, Q. Fan and W. Huang, A perylene diimide zwitterionic polymer for photoacoustic imaging guided photothermal/photodynamic synergistic therapy with single near‐infrared irradiation. J Mater Chem B 6 (2018) 3395
K.S. Valluru, and J.K. Willmann, Clinical photoacoustic imaging of cancer. Ultrasonography 35 (2016) 267
S.C. Hester, M. Kuriakose, C.D. Nguyen, S. Mallidi, Role of ultrasound and photoacoustic imaging in photodynamic therapy for cancer. Photochem. Photobio 96 (2020) 260
H.F. Zhang, K. Maslov, M. Sivaramakrishnan, G. Stoica, L.V. Wang, Imaging of hemoglobin oxygen saturation variations in single vessels in vivo using photoacoustic microscopy. Appl. Phys. Lett. 90 (2007) 053901
M. Li, Y. Tang, J. Yao, Photoacoustic tomography of blood oxygenation: a mini review. Photoacoustics.10 (2018) 65
Y. Yan, S. John, T. Shaik, B. Patel, M.T. Lam, L. Kabbani, M. Mehrmohammadi, Photoacoustic-guided endovenous laser ablation: characterization and in vivo canine study. Photoacoustics 24 (2021) 100298
J.M. Mari, W. Xia, S.J. West, A.E. Desjardins, Interventional multispectral photoacoustic imaging with a clinical ultrasound probe for discriminating nerves and tendons: an ex vivo pilot study. J. Biomed. Opt. 20 (2015) 110503
K. Kratkiewicz , A. Pattyn, N. Alijabbari, M. Mehrmohammadi, Ultrasound and photoacoustic imaging of breast cancer: clinical systems, challenges, and future outlook. J. Clin. Med. 11 (2022)
L. Lin, P. Hu, J. Shi, C.M. Appleton, K. Maslov, L. Li, R. Zhang, L.V. Wang, Single-breath-hold photoacoustic computed tomography of the breast. Nat. Commun. 9 (2018) 2352
S.M. Schoustra, D. Piras, R. Huijink, T. Op 't Root, L. Alink, W.M. Kobold, W. Steenbergen, S. Manohar, Twente Photoacoustic Mammoscope 2: system overview and three-dimensional vascular network images in healthy breasts. J. Biomed. Opt. 24 (2019) 121909
K. Stephens, FDA Approves Seno Medical’s Breast Cancer Diagnostic Technology. AXIS Imaging News. Jan 19, 2021.
Seno Medical Opto-Acoustic Imaging. https://senomedical.com/imagioimaging/how-it-works/opto-acoustic-imaging/
A. Oraevsky, B. Clingman, J. Zalev, A. Stavros, W. Yang, J. Parikh, Clinical optoacoustic imaging combined with ultrasound for coregistered functional and anatomical mapping of breast tumors. Photoacoustics 12 (2018) 30
J.Zalev, D. Herzog, B. Clingman, T. Miller, K. Kist, N.C. Dornbluth, B.M. McCorvey, P. Otto, S. Ermilov, V. Nadvoretsky, Clinical Feasibility Study of Combined Optoacoustic and Ultrasonic Imaging Modality Providing Coregistered Functional and Anatomical Maps of Breast Tumors. International Society for Optics and Photonics; Bellingham, WA, USA: 2012. p. 82230A
K.E. Wilson, S.V. Bachawal, L. Abou-Elkacem, K. Jensen, S. Machtaler, L. Tian, J.K. Willmann, Spectroscopic Photoacoustic Molecular Imaging of Breast Cancer using a B7-H3-targeted ICG Contrast Agent. Theranostics. 7 (2017) 1463 20
A. Garcia-Uribe, T.N. Erpelding, A. Krumholz, H. Ke, K. Maslov, C. Appleton, J.A.Margenthaler, L.V. Wang, Dual-Modality Photoacoustic and Ultrasound Imaging System for Noninvasive Sentinel Lymph Node Detection in Patients with Breast Cancer. Sci. Rep. ,5 (2015) 15748
G.P. Luke , D. Yeager, S.Y. Emelianov, Biomedical applications of photoacoustic imaging with exogenous contrast agents. Ann. Biomed. Eng. 40 (2012) 422.
J. Yao, L.V. Wang, Sensitivity of photoacoustic microscopy. Photoacoustics. 2 (2014) 87
A. De La Zerda, C. Zavaleta, S. Keren, S. Vaithilingam, S. Bodapati, Z. Liu, J. Levi, B.R. Smith, T.-J. Ma, O. Oralkan, Carbon nanotubes as photoacoustic molecular imaging agents in living mice. Nat. Nanotechnol. 3 (2008) 557
A.S. Haka, Z. Volynskaya, J.A.Gardecki, J. Nazemi, J. Lyons, D. Hicks, M. Fitzmaurice, R.R. Dasari, J.P. Crowe, M.S. Feld, In vivo margin assessment during partial mastectomy breast surgery using Raman spectroscopy. Cancer Res. 66 (2006) 3317.
K.E. Peyer, L. Zhang, B.J. Nelson, Bio-inspired magnetic swimming microrobots for biomedical applications. Nanoscale. 5 (2013) 1259
S.Y. Emelianov, P.-C. Li, O'Donnell M. Photoacoustics for molecular imaging and therapy. Phys. Today. 62 (2009) 34
D.-K. Yao, K. Maslov, K.K. Shung, Q. Zhou, L.V. Wang, In vivo label-free photoacoustic microscopy of cell nuclei by excitation of DNA and RNA. Opt. Lett. 35 (2010) 4139.
T.T. Wong, R. Zhang, P. Hai, C. Zhang, M.A. Pleitez, R.L. Aft, D.V. Novack, L.V.Wang, Fast label-free multilayered histology-like imaging of human breast cancer by photoacoustic microscopy. Sci. Adv. 3 (2017) 1602168
K.M. Mak, C.Y.M. PNG, The hepatic Central vein: structure, fibrosis, and role in liver biology, Anat. Rec. 303 (2020) 1747
E. Mercep, J.L. Herraiz, X.L. Dean-Ben, D. Razansky, Transmission-reflection optoacoustic ultrasound (TROPUS) computed tomography of small animals, Light Sci. Appl. 8 (2019) 18
B. Lafci, E. Mercep, J.L. Herraiz, X.L. Dean-Ben, D. Razansky, Noninvasive multiparametric characterization of mammary tumors with Transmission-reflection optoacoustic ultrasound, Neoplasi. 22 (2020) 770
B. Lafci, A. Hadjihambi, M. Determann, C. Konstantinou, et sl., Multimodal assessment of non-alcoholic fatty liver disease with Transmission-reflection optoacoustic ultrasound, Theranostics 13 (2023) 4217
F. Knieling, C. Neufert, A. Hartmann, et al., Multispectral optoacoustic tomography for assessment of Crohn’s disease activity, New Engl. J. Med. 376 (2017) 1292
P.J. van den Berg, K. Daoudi, H.J.B. Moens, W. Steenbergen, Feasibility of photoacoustic/ultrasound imaging of synovitis in finger joints using a point-of-care system, Photoacoustics 8 (2017) 8
J. Jo, G. Xu, M. Cao, et al., A functional study of human inflammatory arthritis using photoacoustic imaging, Sci. Rep. 7 (2017) 15026
A. Dima, V. Ntziachristos, Noninvasive carotid imaging using optoacoustic tomography, Opt. Express 20 (2012) 25044
E. Mercep, X.L. Dean-Ben, D. Razansky, Imaging of blood flow and oxygen state with a multi-segment optoacoustic ultrasound array, Photoacoustics 10 (2018) 48
S. Bohndiek, J. Bunker, J. Grohl, ETA al., International photoacoustic standardization consortium (IPASC): overview, photons plus ultrasound: imaging and sensing 2019, Int. Soc. Optics Photonics (2019) p. 108781N
M. Erfanzadeh, Q. Zhu, Photoacoustic imaging with low-cost sources; a review, Photoacoustics 14 (2019) 1
Y. Zhu, G. Xu, J. Yuan, et al., Light emitting diode based Photoacoustic imaging and potential clinical applications, Sci. Rep. 8 (2018) 9885
A. Hariri, J. Lemaster, J. Wang, et al., The characterization of an economic and portable LED-based Photoacoustic imaging system to facilitate molecular imaging, Photoacoustics 9 (2018) 10
L.M. Yamaleyeva, K B. Brosnihan, L.M. Smith, Y. Sun, Preclinical ultrasound-guided photoacoustic imaging of the placenta in normal and pathologic pregnancy, Mol. Imaging 17 (2018) 1536012118802721
D.J. Lawrence, M.E. Escott, L. Myers, S. Intapad, S.H. Lindsey, C.L. Bayer, Spectral photoacoustic imaging to estimate in vivo placental oxygenation during preeclampsia, Sci. Rep. 9 (2019) 558
Y. Qu, C. Li, J. Shi, R. Chen et al., Transvaginal fast-scanning optical-resolution photoacoustic endoscopy, J. Biomed. Opt. 23 (2018) 121617
P.D. Kumavor, U. Alqasemi, B. Tavakoli, et al., Co-registered pulse-echo/photoacoustic transvaginal probe for real-time imaging of ovarian tissue, J. Biophotonics 6 (2013) 475
P. Lai, L. Wang, J.W. Tay, L.V. Wang, Photoacoustically guided wavefront shaping for enhanced optical focusing in scattering media, Nat. Photonics 9 (2015) 126
J.H. Park, Z. Yu, K. Lee, P. Lai, Y. Park, Wavefront shaping techniques for controlling multiple light scattering in biological tissue: Toward in vivo applications, AOL Photonics 3 (2018) 100901
A.A. Plumb, N.T. Huynh, J. Guggenheim, E. Zhang, P. Beard, Rapid volumetric tomographic imaging with Fabry-Perot ultrasound sensor depicts peripheral arteries to thermal stimuli, Euro. Radiol. 28 (2018) 1037
W. Ren, H. Skulason, F. Schlegel, et al., Automated registration of magnetic resonance imaging and optoacoustic tomography data for experimental studies, Neurophotonics 6 (2019) 025001
No comments:
Post a Comment